2023 Timeline
~
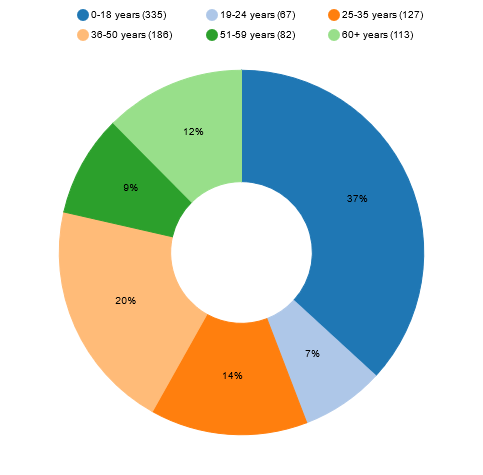
Demographics
2023
2022
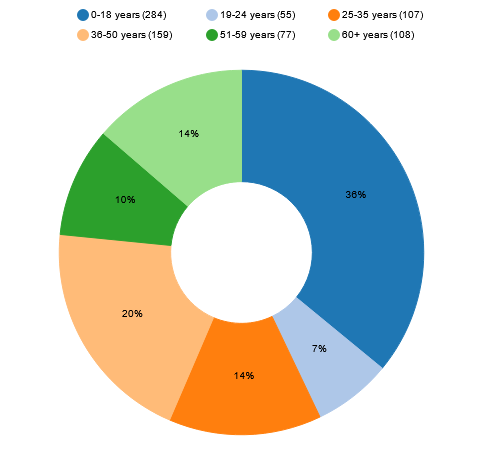
Year after year, youth and children under the age of 19 represent more then one third of those served by our Food Bank. These demographics have remained the same despite increases in visits and clients.
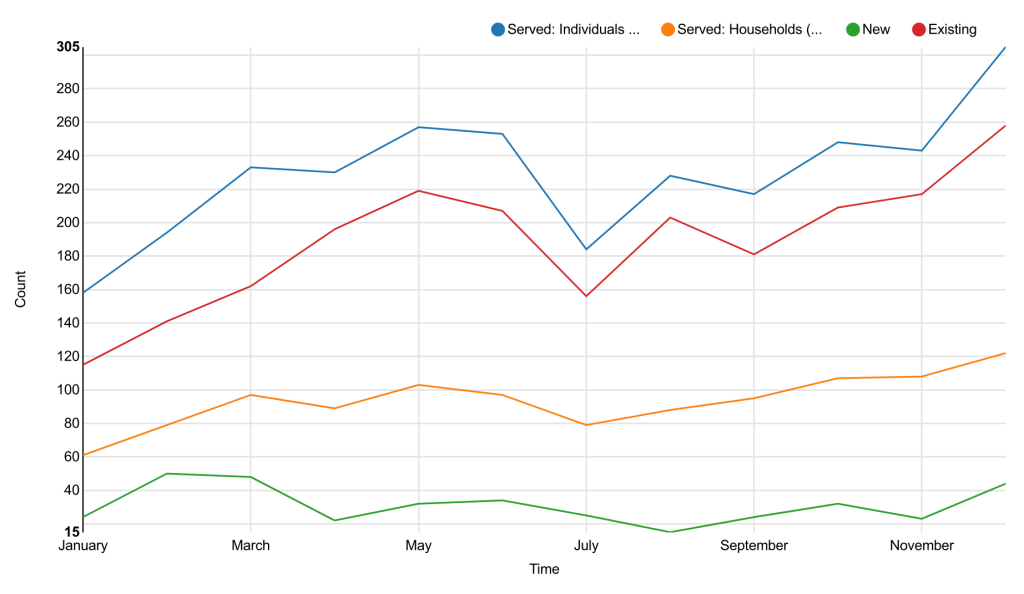
Historical Stats
January 2019 – March 2024 Timeline

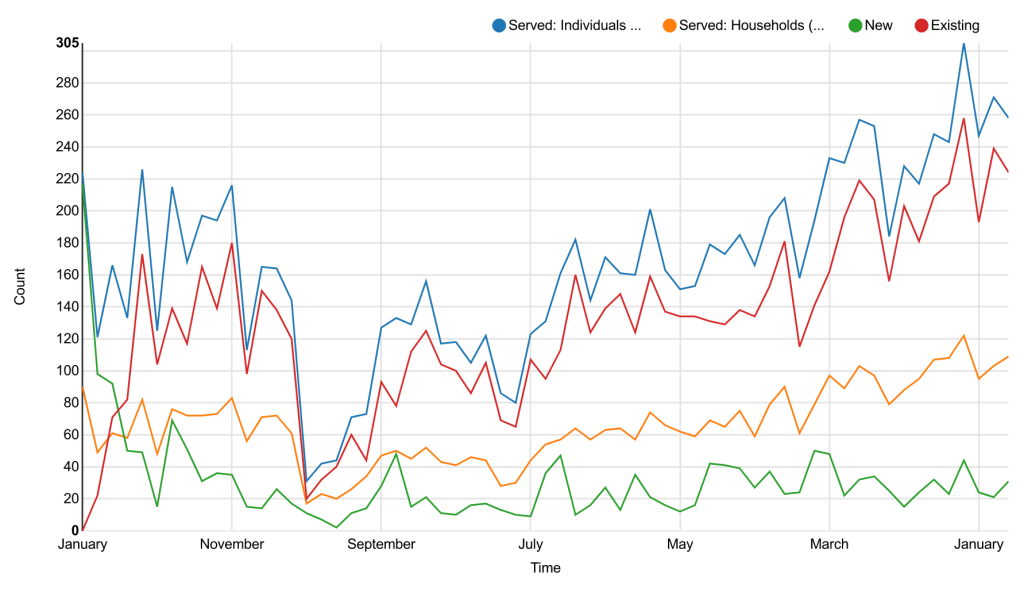
On January 1st 2019 a new database was implemented; as a result clients that were not new were recognized as new to the system. For this reason data regarding new clients in 2019 is not reliable.
A large drop in clients occurred in April 2020 shortly after the Covid-10 pandemic was declared. This has been interpreted to be a result of individuals staying home to stay safe, and also challenges that may have occurred for clients as a result of our service changing from a drop in service to an appointment service. A gradual increase in households and individuals served can be seen May – September 2021, perhaps as individuals adjusted to the new circumstances.
Over August and September of 2021, there was a large increase in new clients, that seems to have coincided with inflation rate increases. Spikes in new clients continued in 2022 as costs continued to inflate. December 2023 shows the highest recorded monthly visits (122 hampers) on record, as prices continue to increase.
Statistics prior to 2019 can be found on the “ABOUT” tab of this website in the timeline image, except 2018 that had 745 hampers recorded. Inconsistencies in statistics collected prior to 2019 were suspected (can not be verified as our previous data was deleted yearly) and could put some pre 2019 data into question.